> ## Documentation Index
> Fetch the complete documentation index at: https://docs.conduit.ai/llms.txt
> Use this file to discover all available pages before exploring further.
# Queue report
> What every number on the queue report means, and how the totals fit together
The queue report answers one question: of every call that came in, where did it end up?
## Where to find this data
For one workspace, open Conduit and go to **Insights → Queue report**. Everything on this page is on that one screen.
For the organization-wide view, go to **Workforce**. The same report is split across three tabs, each rolling up every workspace you have access to:
| Tab | What it shows |
| - | - |
| Overview | The headline totals, the inbound-path breakdown, volume over time, and a **By workspace** table with a row per workspace. |
| Team | The per-member table, across workspaces. |
| Misses | A **Missed calls by workspace** table you can click into for the individual calls, then the missed-call headline, recovery metrics, why calls were missed, and the time-of-week heatmap. |
The Live and Availability tabs are real-time views, not part of the report. On Availability, the business unit dropdown defaults to **All business units** and narrows the timeline to one workspace. The selection is stored in the URL, so you can share or bookmark the filtered view.
## How the totals fit together
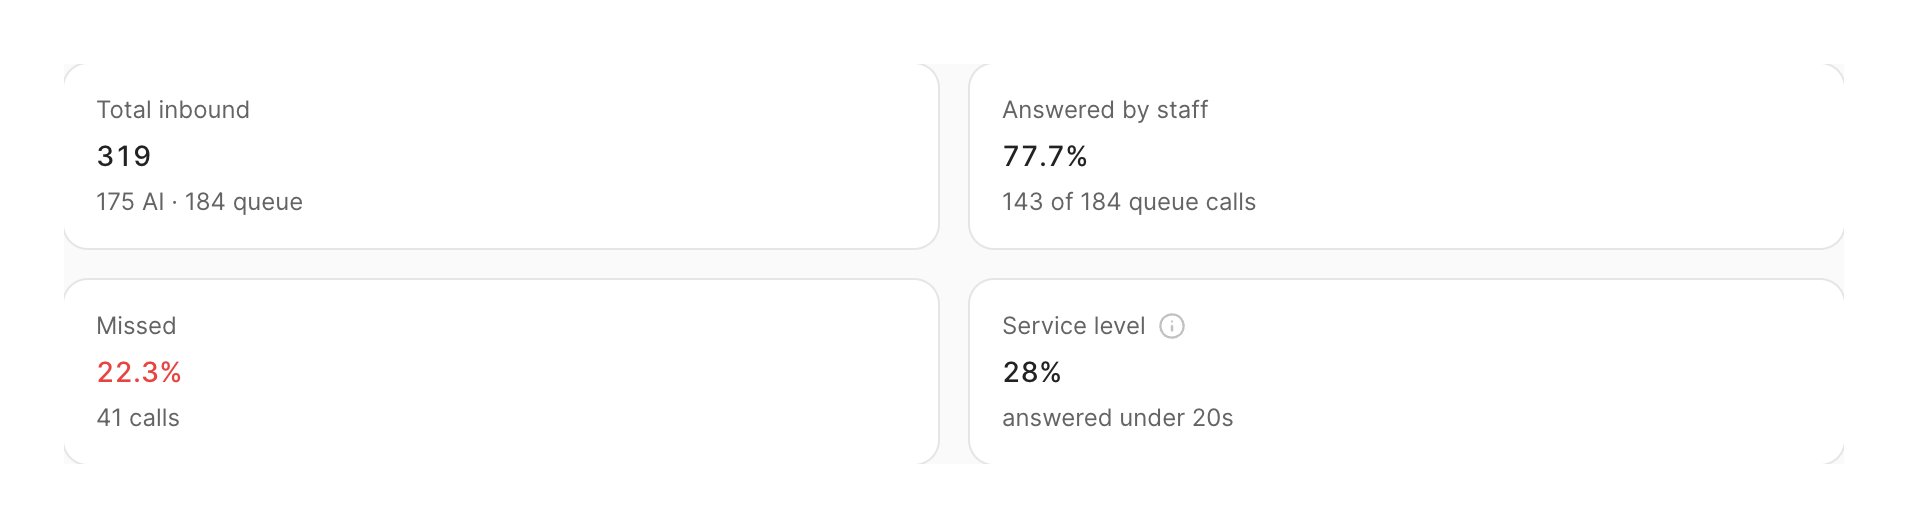 **Total inbound** counts every call that reached you, whether a person picked it up or the AI agent handled it on its own.
**Answered by team**, **Missed**, and **Abandoned** only count calls that reached the human queue. Together they account for all queue calls, not all inbound calls: calls the AI resolved without involving anyone never entered the queue.
Every inbound call lands in exactly one of four paths, and those four always sum back to total inbound:
| Path | Meaning |
| - | - |
| Resolved by AI | The AI agent handled the call start to finish. Nobody was rung. |
| AI to team | The AI answered, then transferred the caller to a person. |
| Ended at AI | The call reached the AI and ended there without a transfer or a resolution. Usually the caller hung up. |
| Direct to team | The call went straight to the queue without the AI answering first. |
Answered, Missed, and Abandoned describe the *outcome* of a queue call, so they cut across those paths rather than adding to them. A transferred call can be answered, missed, or abandoned, and so can a direct one.
**Total inbound** counts every call that reached you, whether a person picked it up or the AI agent handled it on its own.
**Answered by team**, **Missed**, and **Abandoned** only count calls that reached the human queue. Together they account for all queue calls, not all inbound calls: calls the AI resolved without involving anyone never entered the queue.
Every inbound call lands in exactly one of four paths, and those four always sum back to total inbound:
| Path | Meaning |
| - | - |
| Resolved by AI | The AI agent handled the call start to finish. Nobody was rung. |
| AI to team | The AI answered, then transferred the caller to a person. |
| Ended at AI | The call reached the AI and ended there without a transfer or a resolution. Usually the caller hung up. |
| Direct to team | The call went straight to the queue without the AI answering first. |
Answered, Missed, and Abandoned describe the *outcome* of a queue call, so they cut across those paths rather than adding to them. A transferred call can be answered, missed, or abandoned, and so can a direct one.
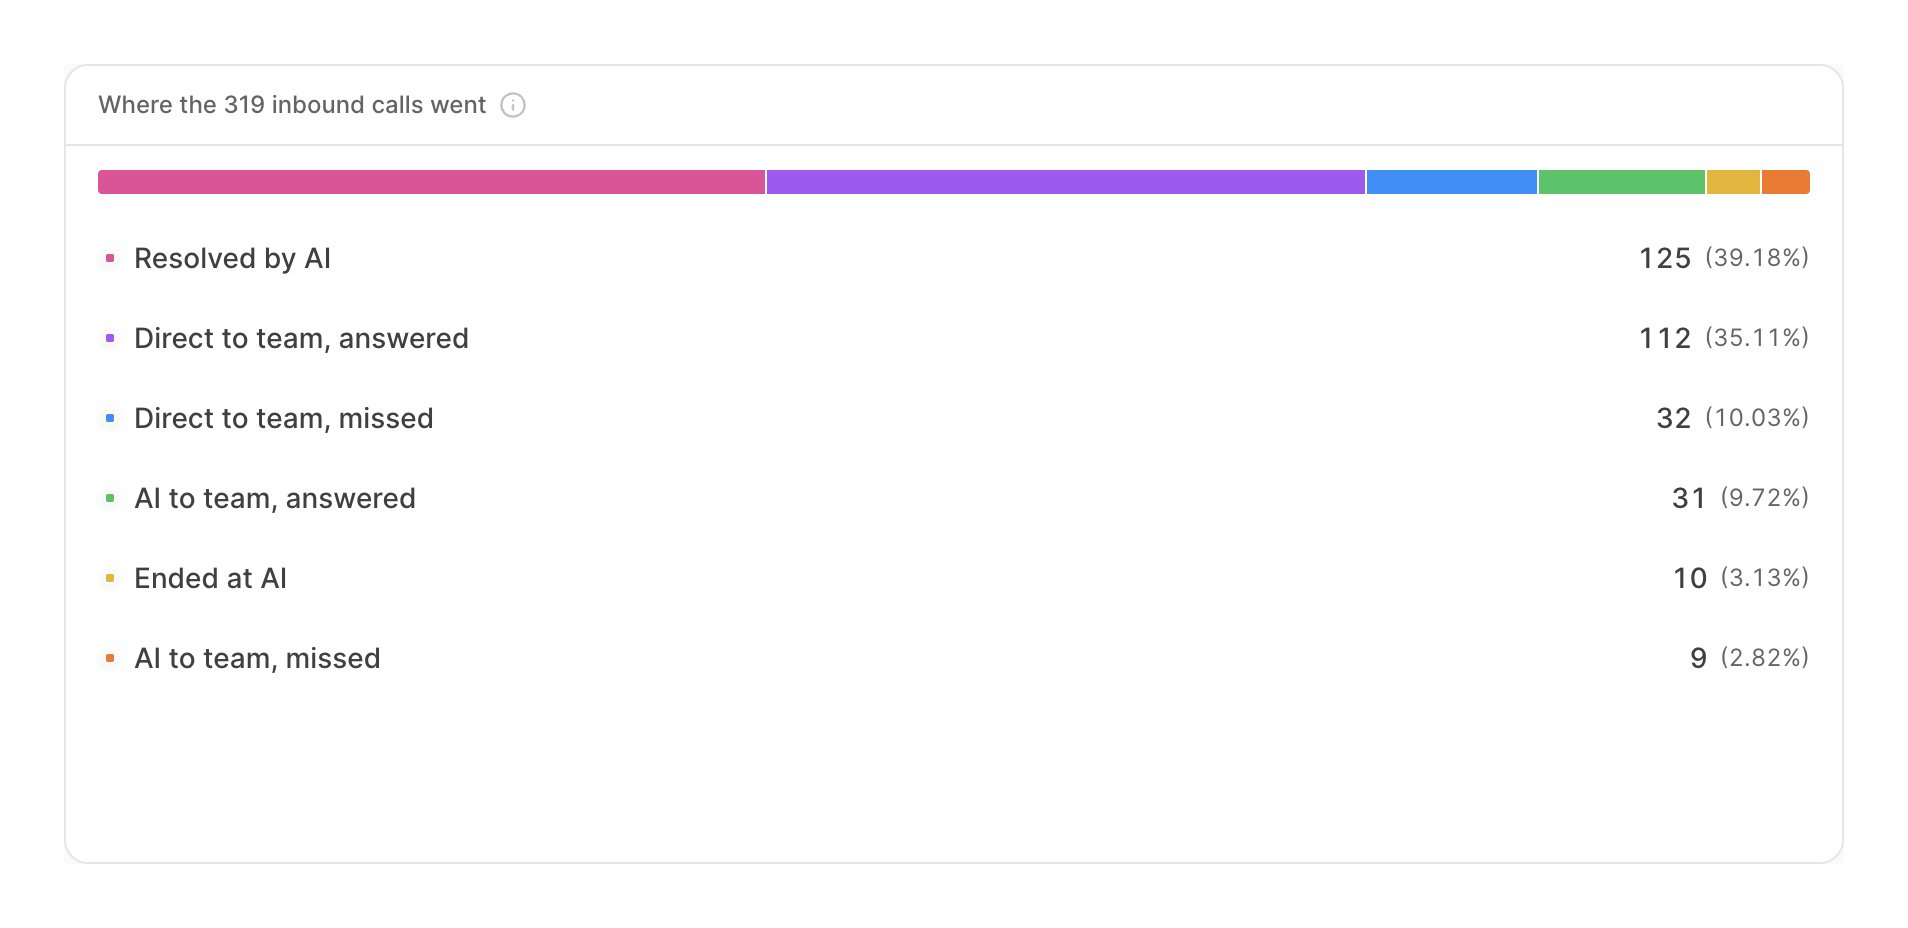 A call the AI transferred is counted once, under its transfer outcome. It is not counted again as a new inbound call.
### By workspace columns
On **Workforce → Overview**, the **By workspace** table uses the same definitions for every row. Workforce tables on Live, Overview, Team and Misses show every row without pagination. Click a numeric column header once to sort descending and again to sort ascending; the active column shows an arrow. Sorting uses the underlying value, so **SLA**, **ASA**, **Longest wait**, **Avg talk** and **Available** sort correctly rather than alphabetically.
| Column | Meaning |
| - | - |
| Workspace | The Conduit workspace the row reports on. |
| Inbound | All inbound calls received by the workspace. Each call is counted once, and this number always equals **Resolved by AI + AI to team + Ended at AI + Direct to team**. |
| Missed | Calls that reached the team but nobody answered, excluding abandoned calls. Includes both AI transfers and calls that went directly to the team. Calls that **Ended at AI** are not included. |
| Answered | Calls the team answered, including both AI transfers and calls that went directly to the team. Calls resolved by the AI are not included. |
| SLA | Service level: the share of answered team calls picked up within 20 seconds. Missed calls are not included in the denominator. |
| ASA | Average speed of answer: the mean wait before a team member answered, across answered calls only. |
| Resolved by AI | Inbound calls the AI handled from start to finish without transferring to the team. |
| AI to team | Inbound calls the AI transferred to the team. Each call appears here once whether answered, missed, or abandoned. |
| Ended at AI | Inbound calls that ended with the AI without being resolved or transferred to the team, usually because the caller hung up. These are not team misses because the calls never entered the human queue. |
| Direct to team | Inbound calls that went straight to the human queue without the AI answering first. Each call appears here once whether answered, missed, or abandoned. |
| Longest wait | The longest time a caller waited for the team before the call was answered, missed, or abandoned. |
| Recovered | Missed calls where the caller later got through or someone called them back through Conduit. Calls team members make back from a mobile are not visible here. |
## Service level, SLA and ASA
**Service level** is the share of answered calls picked up within 20 seconds. The denominator is answered calls, not all calls, so a workspace that misses a lot can still show a high service level. Read it alongside the miss rate, never on its own.
**ASA** is average speed of answer: the mean wait before someone picked up, across answered calls only.
**Longest wait** is the single worst wait in the range, with the time it happened. Useful for finding the moment a queue fell over rather than the average day.
## Missed calls
A call the AI transferred is counted once, under its transfer outcome. It is not counted again as a new inbound call.
### By workspace columns
On **Workforce → Overview**, the **By workspace** table uses the same definitions for every row. Workforce tables on Live, Overview, Team and Misses show every row without pagination. Click a numeric column header once to sort descending and again to sort ascending; the active column shows an arrow. Sorting uses the underlying value, so **SLA**, **ASA**, **Longest wait**, **Avg talk** and **Available** sort correctly rather than alphabetically.
| Column | Meaning |
| - | - |
| Workspace | The Conduit workspace the row reports on. |
| Inbound | All inbound calls received by the workspace. Each call is counted once, and this number always equals **Resolved by AI + AI to team + Ended at AI + Direct to team**. |
| Missed | Calls that reached the team but nobody answered, excluding abandoned calls. Includes both AI transfers and calls that went directly to the team. Calls that **Ended at AI** are not included. |
| Answered | Calls the team answered, including both AI transfers and calls that went directly to the team. Calls resolved by the AI are not included. |
| SLA | Service level: the share of answered team calls picked up within 20 seconds. Missed calls are not included in the denominator. |
| ASA | Average speed of answer: the mean wait before a team member answered, across answered calls only. |
| Resolved by AI | Inbound calls the AI handled from start to finish without transferring to the team. |
| AI to team | Inbound calls the AI transferred to the team. Each call appears here once whether answered, missed, or abandoned. |
| Ended at AI | Inbound calls that ended with the AI without being resolved or transferred to the team, usually because the caller hung up. These are not team misses because the calls never entered the human queue. |
| Direct to team | Inbound calls that went straight to the human queue without the AI answering first. Each call appears here once whether answered, missed, or abandoned. |
| Longest wait | The longest time a caller waited for the team before the call was answered, missed, or abandoned. |
| Recovered | Missed calls where the caller later got through or someone called them back through Conduit. Calls team members make back from a mobile are not visible here. |
## Service level, SLA and ASA
**Service level** is the share of answered calls picked up within 20 seconds. The denominator is answered calls, not all calls, so a workspace that misses a lot can still show a high service level. Read it alongside the miss rate, never on its own.
**ASA** is average speed of answer: the mean wait before someone picked up, across answered calls only.
**Longest wait** is the single worst wait in the range, with the time it happened. Useful for finding the moment a queue fell over rather than the average day.
## Missed calls
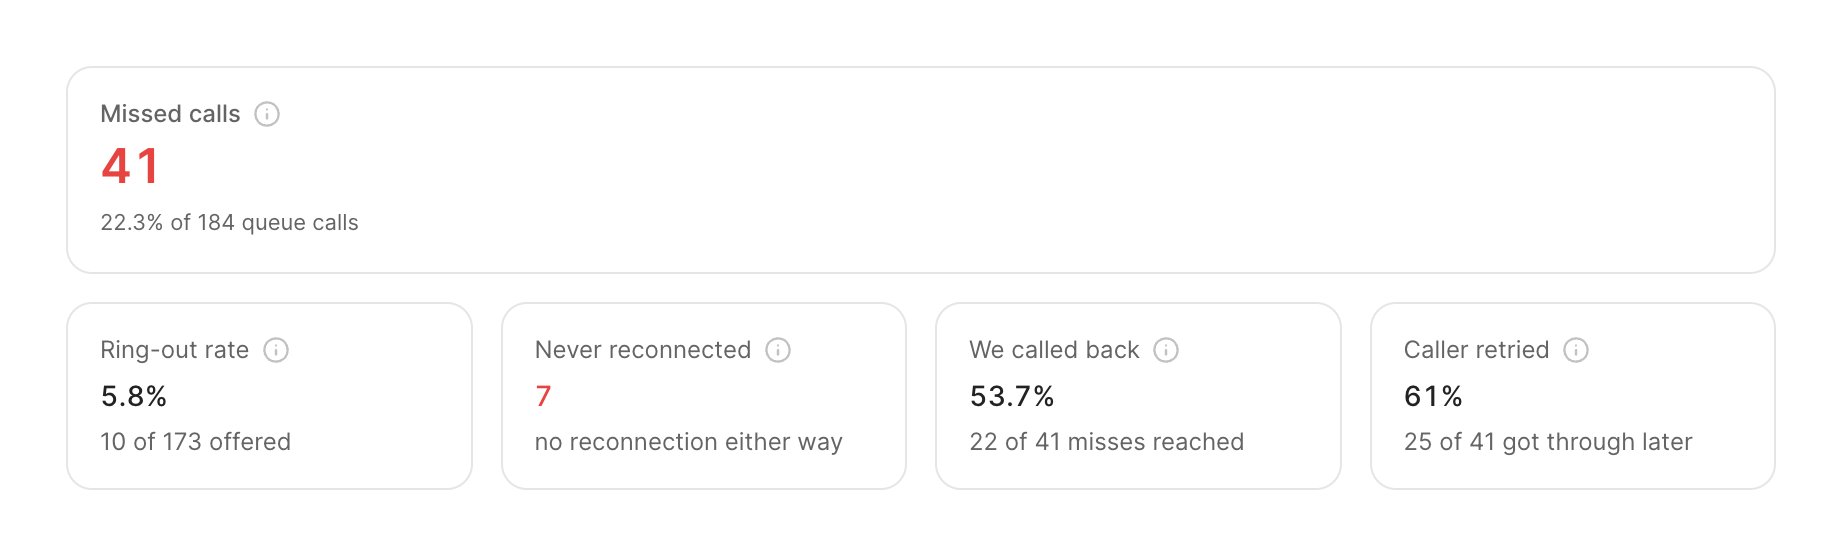 **Missed calls** on the Workforce Misses tab counts queue calls that were not answered because nobody was available, ringing timed out, or everyone declined. It excludes abandoned calls. The rate underneath divides missed calls by all queue calls in the selected workspaces and date range, including answered, missed, and abandoned calls.
**Abandoned call rate** appears beside Missed calls. It counts calls classified as caller hangups while waiting for the team, divided by all queue calls, with the raw count and denominator underneath. Calls that end at the AI without reaching the queue are not included. The report uses the recorded routing outcome to separate caller hangups from nobody available, ring-out, and declined, so the counts do not overlap.
For example, 132 previously reported misses containing 37 abandoned calls become **95 missed calls (28.2% of 337 queue calls)** and an **11.0% abandoned call rate (37 of 337 queue calls)**.
This definition applies whenever a date range is computed, including historical ranges. No stored call records are changed. Previously saved CSVs keep their old totals; re-exporting the same range excludes abandoned calls from missed totals, recovery metrics, and missed-call buckets.
The four tiles under it are the recovery metrics, explained further down. On the workspace report the same four tiles sit in a row with speed of answer, longest wait, outbound calls and AI resolutions.
## Missed calls by workspace
**Missed calls** on the Workforce Misses tab counts queue calls that were not answered because nobody was available, ringing timed out, or everyone declined. It excludes abandoned calls. The rate underneath divides missed calls by all queue calls in the selected workspaces and date range, including answered, missed, and abandoned calls.
**Abandoned call rate** appears beside Missed calls. It counts calls classified as caller hangups while waiting for the team, divided by all queue calls, with the raw count and denominator underneath. Calls that end at the AI without reaching the queue are not included. The report uses the recorded routing outcome to separate caller hangups from nobody available, ring-out, and declined, so the counts do not overlap.
For example, 132 previously reported misses containing 37 abandoned calls become **95 missed calls (28.2% of 337 queue calls)** and an **11.0% abandoned call rate (37 of 337 queue calls)**.
This definition applies whenever a date range is computed, including historical ranges. No stored call records are changed. Previously saved CSVs keep their old totals; re-exporting the same range excludes abandoned calls from missed totals, recovery metrics, and missed-call buckets.
The four tiles under it are the recovery metrics, explained further down. On the workspace report the same four tiles sit in a row with speed of answer, longest wait, outbound calls and AI resolutions.
## Missed calls by workspace
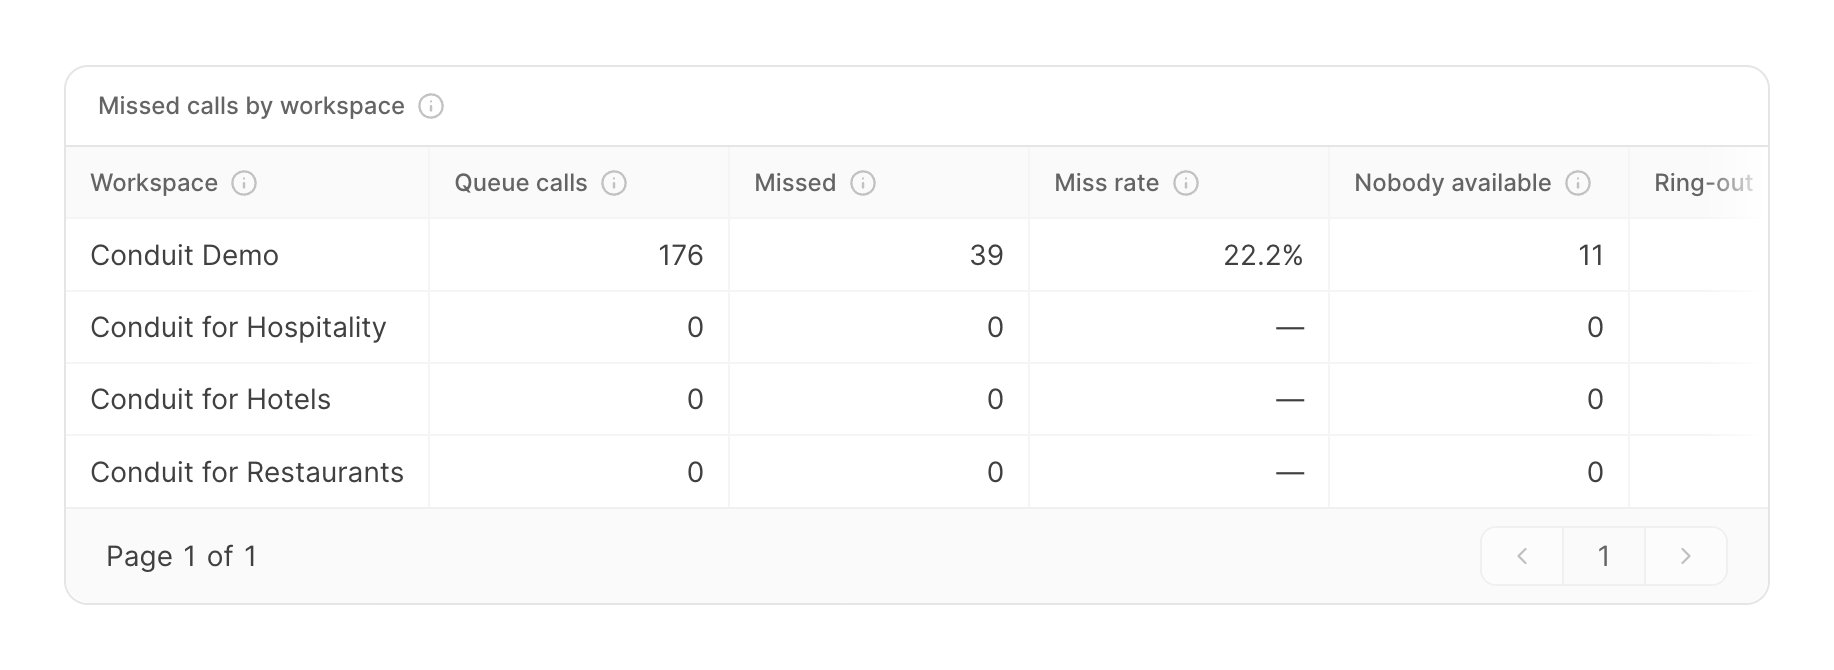 At the top of the Misses tab, above the tiles, this table has one row per workspace so you can see which one is missing calls instead of reading a blended total. Every number in it is an actual call, not an average or a rate across team members.
| Column | Meaning |
| - | - |
| Queue calls | Calls that reached the human queue in that workspace: answered plus missed plus abandoned. |
| Missed | Queue calls nobody answered, excluding abandoned calls. |
| Miss rate | Missed as a share of queue calls. |
| Nobody available, Ring-out, Declined | The missed count split by reason, using the same definitions as [Why calls were missed](#why-calls-were-missed). |
| Abandoned | Caller hangups while waiting for the team, counted separately from missed. |
| Recovered | Missed calls where the caller later got through, by either path described under [Recovery metrics](#recovery-metrics). |
By default, rows are sorted by missed calls, highest first. Any numeric column header re-sorts the table. The table follows the same date range and workspace filter as the rest of the tab. Scroll sideways to see the later columns on a narrow window.
Nobody available, Ring-out, and Declined sum to Missed. Abandoned is a separate outcome and must not be added to the missed total.
### Viewing the calls behind a row
At the top of the Misses tab, above the tiles, this table has one row per workspace so you can see which one is missing calls instead of reading a blended total. Every number in it is an actual call, not an average or a rate across team members.
| Column | Meaning |
| - | - |
| Queue calls | Calls that reached the human queue in that workspace: answered plus missed plus abandoned. |
| Missed | Queue calls nobody answered, excluding abandoned calls. |
| Miss rate | Missed as a share of queue calls. |
| Nobody available, Ring-out, Declined | The missed count split by reason, using the same definitions as [Why calls were missed](#why-calls-were-missed). |
| Abandoned | Caller hangups while waiting for the team, counted separately from missed. |
| Recovered | Missed calls where the caller later got through, by either path described under [Recovery metrics](#recovery-metrics). |
By default, rows are sorted by missed calls, highest first. Any numeric column header re-sorts the table. The table follows the same date range and workspace filter as the rest of the tab. Scroll sideways to see the later columns on a narrow window.
Nobody available, Ring-out, and Declined sum to Missed. Abandoned is a separate outcome and must not be added to the missed total.
### Viewing the calls behind a row
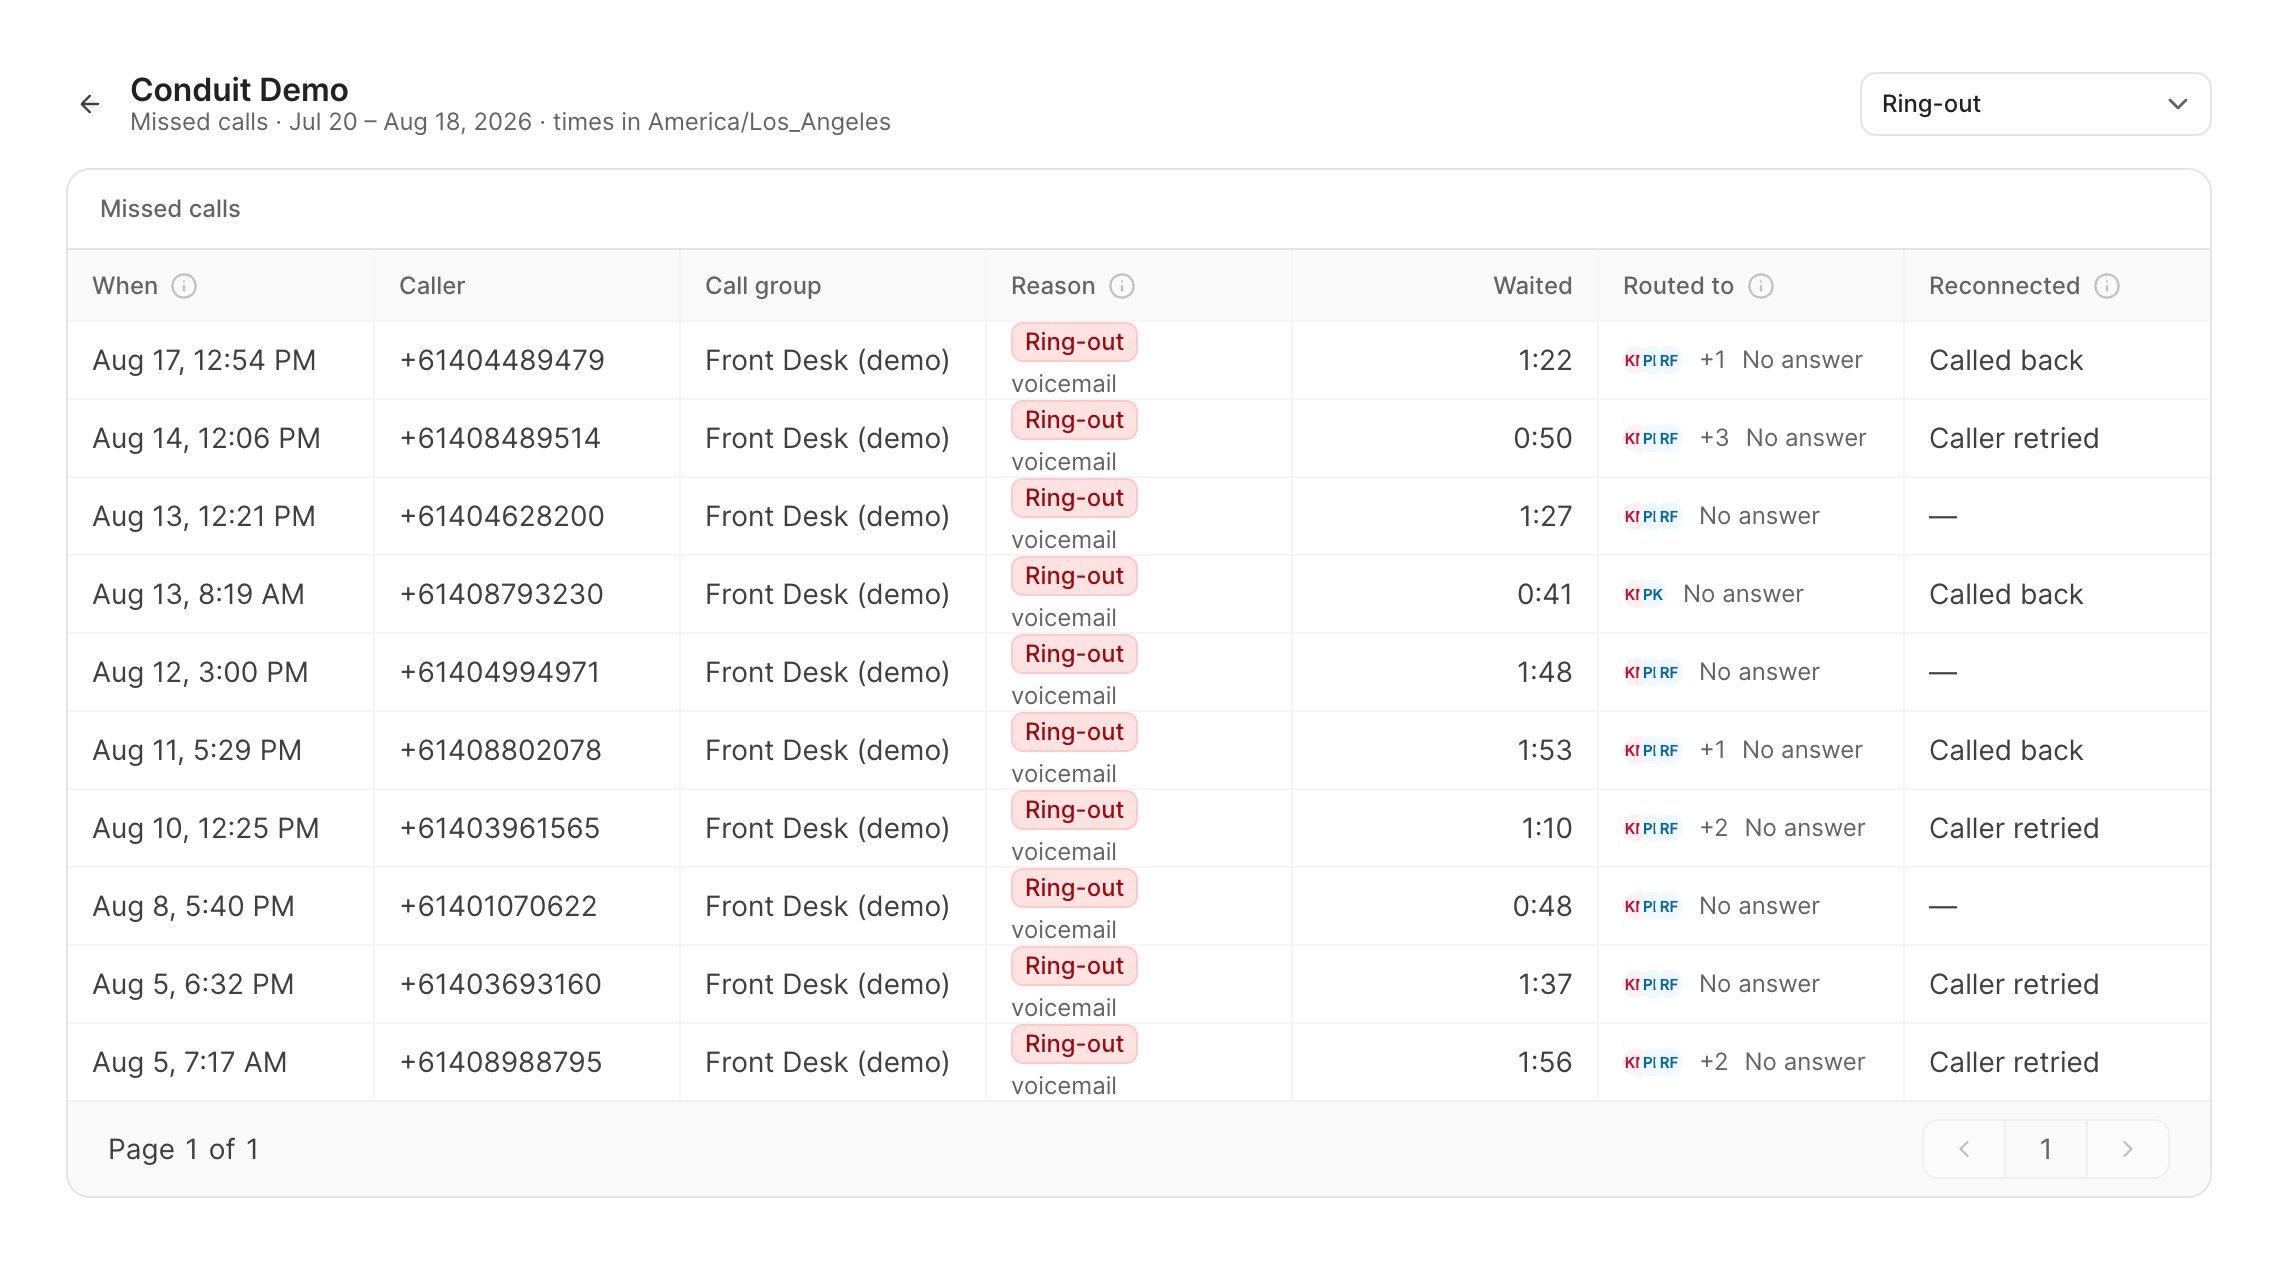 Click any workspace row to open its missed calls for the same range. The list stays inside Workforce, so the date range and timezone at the top still apply, and the back arrow returns you to the table.
Each row is one missed call:
| Column | Meaning |
| - | - |
| When | Call start time, in the timezone shown in the header. |
| Caller | The number that called. |
| Call group | The queue the call was routed to. |
| Reason | Nobody available, Ring-out, or Declined. Abandoned calls are excluded from this list. A **voicemail** note underneath means the call carried on to voicemail after the miss rather than ending with a hang-up. |
| Waited | How long the caller held before the call ended. |
| Routed to | Who the call was offered to, with a tooltip on each person showing whether they timed out or declined. If nobody could be offered the call, it shows **No one available** and hovering explains why (away, on a call, unavailable). |
| Reconnected | **Called back** means someone on your team later reached that number through Conduit. **Caller retried** means the same number rang again and got through. A dash means neither happened. |
Use the reason dropdown in the header to narrow the list to one reason, for example only ring-outs when you are checking responsiveness. The list shows the newest 500 missed calls in the range; shorten the range if you need to see everything.
## Why calls were missed
Click any workspace row to open its missed calls for the same range. The list stays inside Workforce, so the date range and timezone at the top still apply, and the back arrow returns you to the table.
Each row is one missed call:
| Column | Meaning |
| - | - |
| When | Call start time, in the timezone shown in the header. |
| Caller | The number that called. |
| Call group | The queue the call was routed to. |
| Reason | Nobody available, Ring-out, or Declined. Abandoned calls are excluded from this list. A **voicemail** note underneath means the call carried on to voicemail after the miss rather than ending with a hang-up. |
| Waited | How long the caller held before the call ended. |
| Routed to | Who the call was offered to, with a tooltip on each person showing whether they timed out or declined. If nobody could be offered the call, it shows **No one available** and hovering explains why (away, on a call, unavailable). |
| Reconnected | **Called back** means someone on your team later reached that number through Conduit. **Caller retried** means the same number rang again and got through. A dash means neither happened. |
Use the reason dropdown in the header to narrow the list to one reason, for example only ring-outs when you are checking responsiveness. The list shows the newest 500 missed calls in the range; shorten the range if you need to see everything.
## Why calls were missed
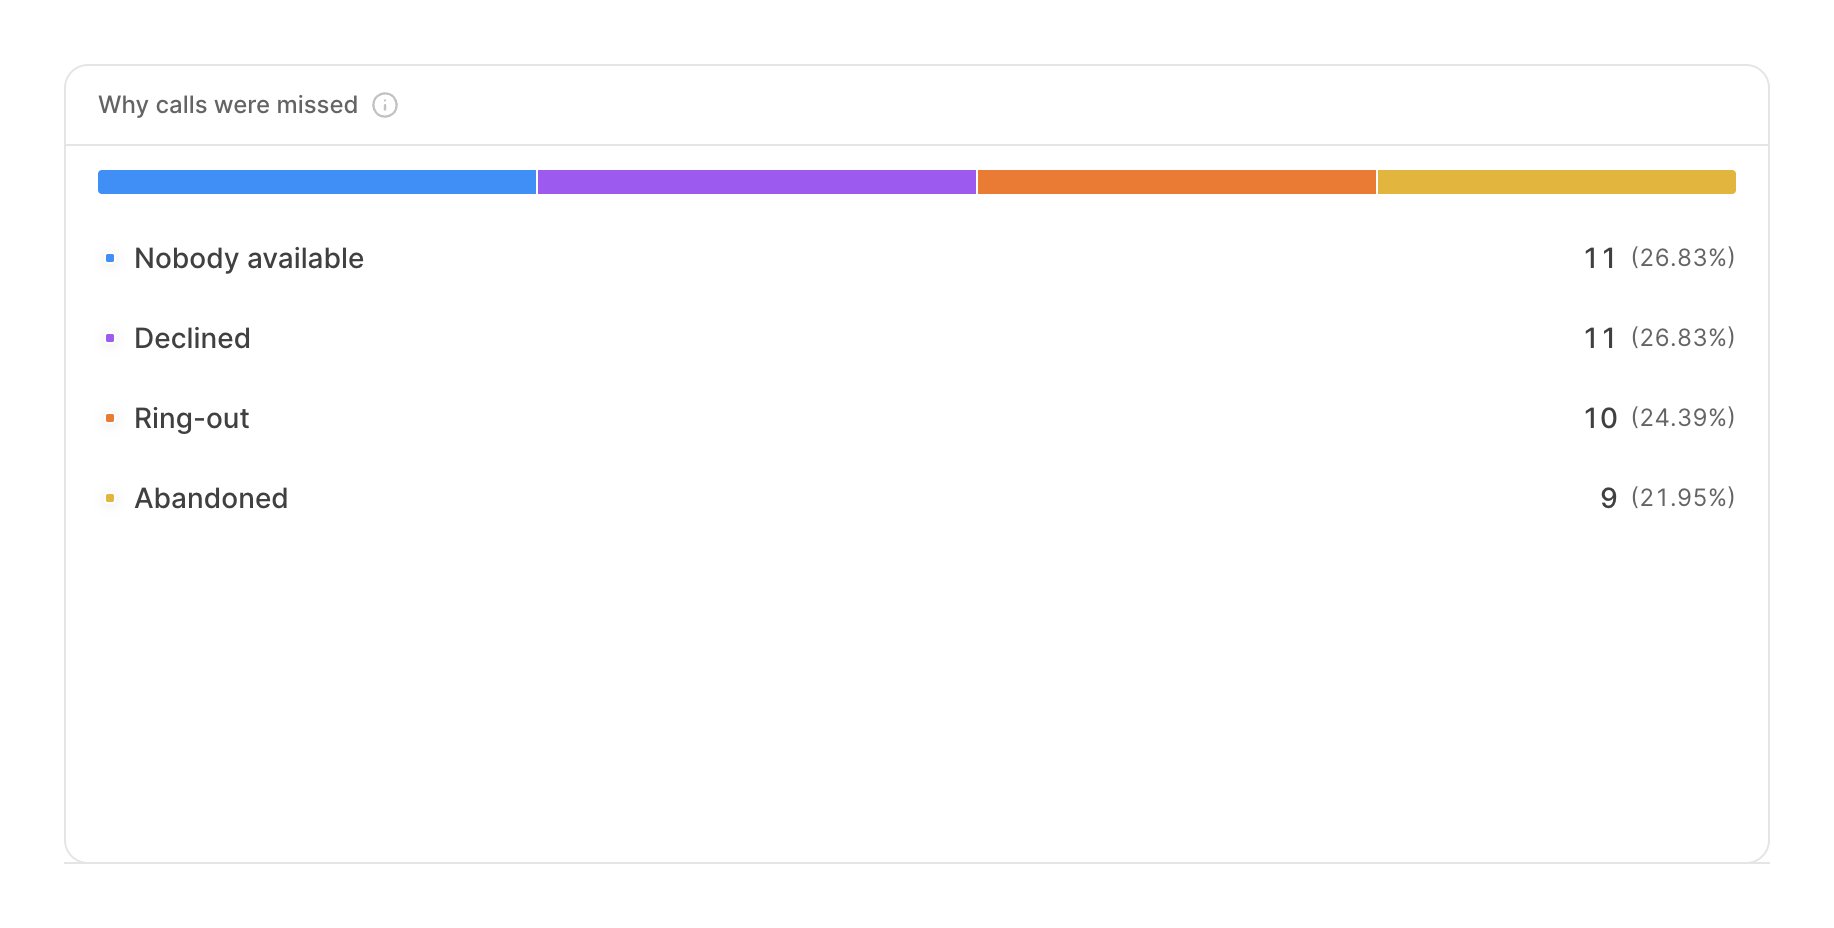 These three reasons are mutually exclusive, and every missed call falls into exactly one. Abandoned calls are shown separately in the Abandoned call rate tile and the per-workspace Abandoned column.
| Reason | Meaning |
| - | - |
| Nobody available | No one could be offered the call at all. Everyone was away, on a call, or in wrap-up. |
| Ring-out | It rang at least one person and nobody picked up before the ring timer expired. |
| Declined | Everyone who was offered the call actively rejected it. |
The split matters because the fixes are different. Ring-out is a responsiveness problem. Nobody available is a staffing problem. Abandoned is usually a wait-time problem.
## Recovery metrics
**Ring-out rate** is ring-outs divided by calls that were actually offered to somebody. It deliberately excludes calls where nobody was available to ring and calls the guest abandoned, so it measures only this: when we rang a person, how often did nobody pick up. This is the number to watch for staffing and responsiveness.
**We called back** is the share of missed calls where someone on your team later rang that number back.
This only counts callbacks placed through Conduit. If your team members return calls from a mobile or a property landline, those are invisible to the report, so your real callback rate is higher than the number shown.
**Caller retried** is the share of missed calls where the guest rang back themselves and that later call was answered. A high number is not reassurance. It means guests are getting through, but only because they did the chasing, and each of those guests is counted as two inbound calls.
**Never reconnected** is missed calls where the guest never reached anyone, by either path. If you want one number to act on, this is it. It is the closest thing the report has to lost business.
## Missed calls by time of week
These three reasons are mutually exclusive, and every missed call falls into exactly one. Abandoned calls are shown separately in the Abandoned call rate tile and the per-workspace Abandoned column.
| Reason | Meaning |
| - | - |
| Nobody available | No one could be offered the call at all. Everyone was away, on a call, or in wrap-up. |
| Ring-out | It rang at least one person and nobody picked up before the ring timer expired. |
| Declined | Everyone who was offered the call actively rejected it. |
The split matters because the fixes are different. Ring-out is a responsiveness problem. Nobody available is a staffing problem. Abandoned is usually a wait-time problem.
## Recovery metrics
**Ring-out rate** is ring-outs divided by calls that were actually offered to somebody. It deliberately excludes calls where nobody was available to ring and calls the guest abandoned, so it measures only this: when we rang a person, how often did nobody pick up. This is the number to watch for staffing and responsiveness.
**We called back** is the share of missed calls where someone on your team later rang that number back.
This only counts callbacks placed through Conduit. If your team members return calls from a mobile or a property landline, those are invisible to the report, so your real callback rate is higher than the number shown.
**Caller retried** is the share of missed calls where the guest rang back themselves and that later call was answered. A high number is not reassurance. It means guests are getting through, but only because they did the chasing, and each of those guests is counted as two inbound calls.
**Never reconnected** is missed calls where the guest never reached anyone, by either path. If you want one number to act on, this is it. It is the closest thing the report has to lost business.
## Missed calls by time of week
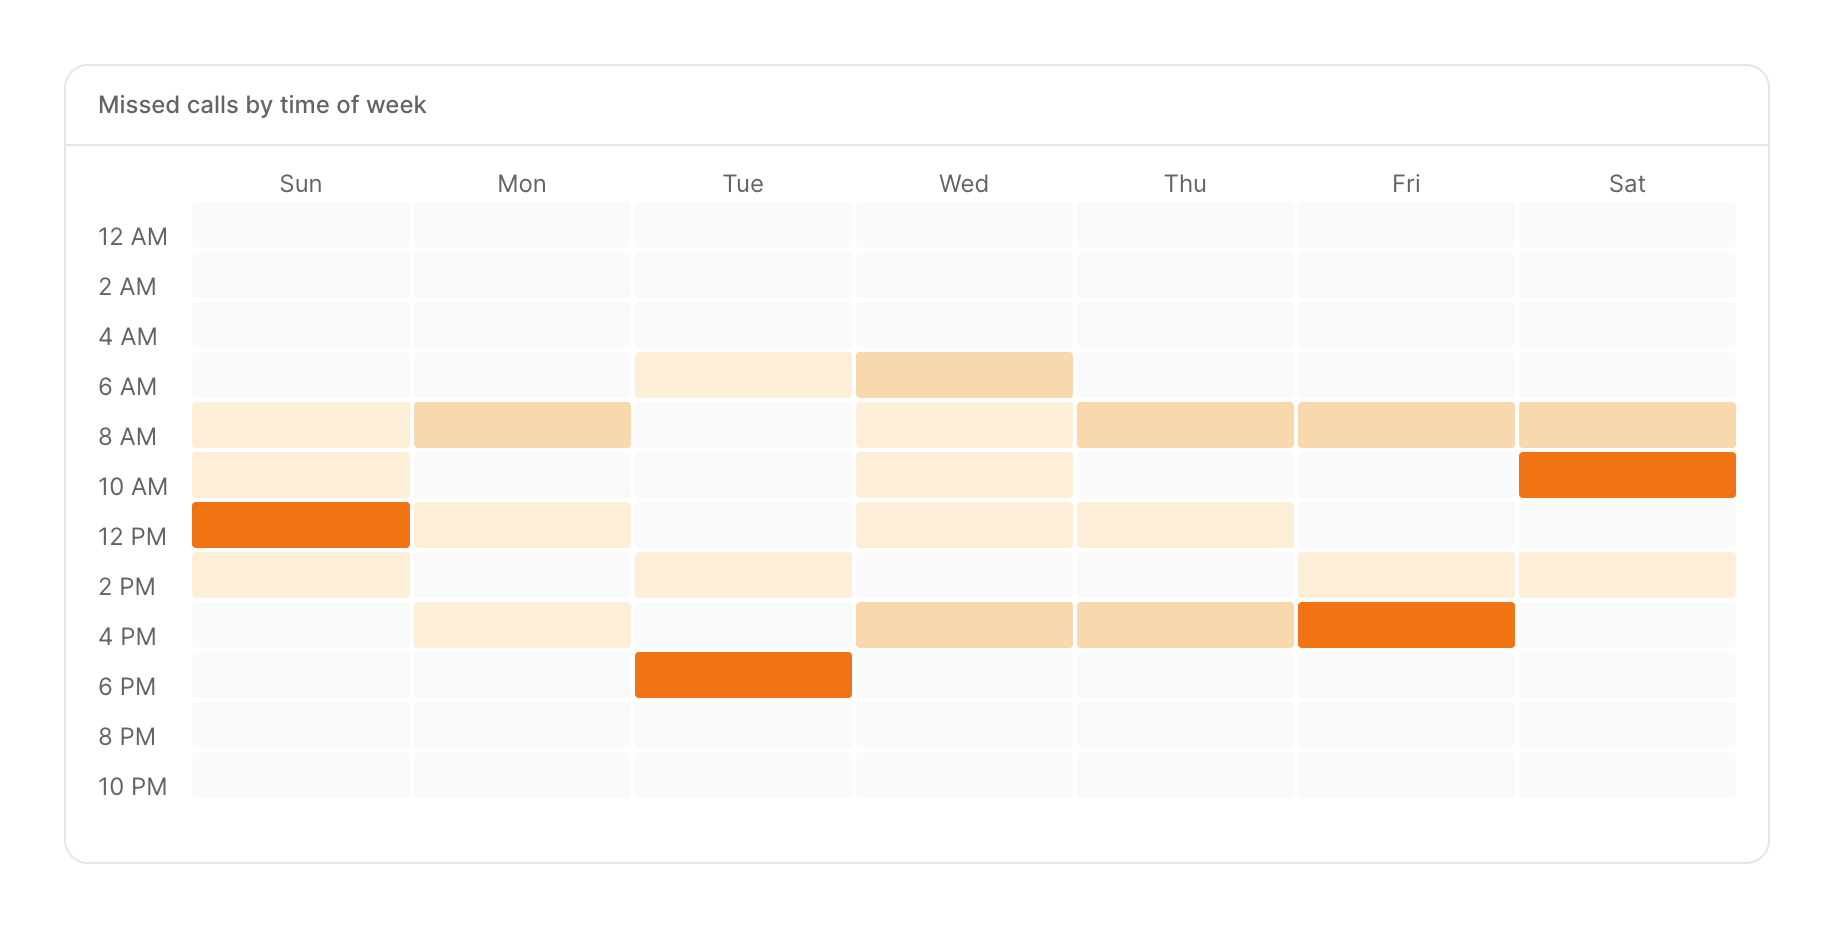 Each cell is a two-hour block in the report's timezone, shaded by how many calls were missed in it. Use it to find the recurring gaps, the shift change, the lunch hour, the Sunday evening nobody is rostered for.
## Choosing a date range
Each cell is a two-hour block in the report's timezone, shaded by how many calls were missed in it. Use it to find the recurring gaps, the shift change, the lunch hour, the Sunday evening nobody is rostered for.
## Choosing a date range
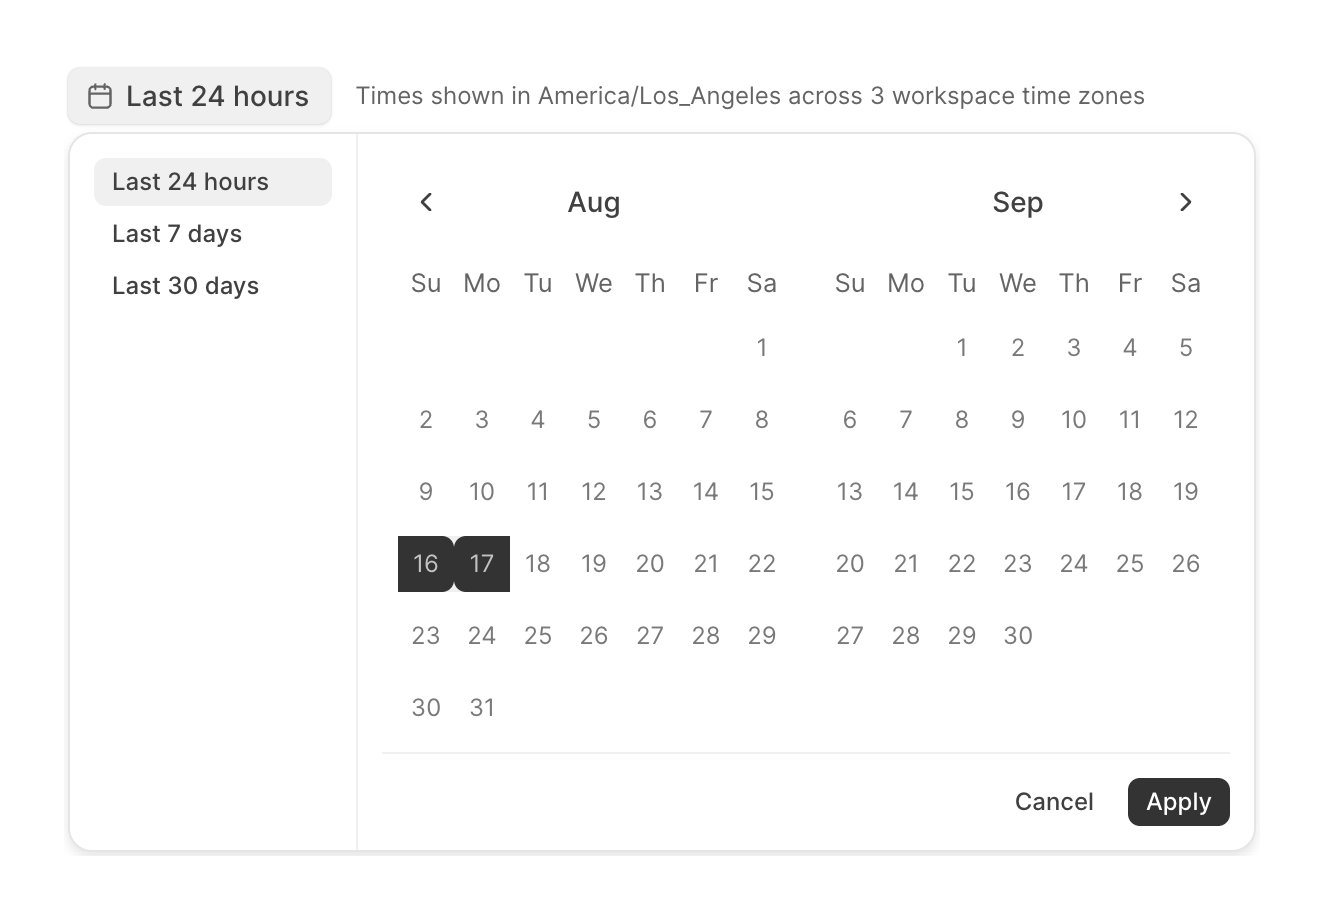 Workforce opens on **Last 24 hours**: a rolling window from exactly 24 hours ago to now, bucketed by the hour. It is not "yesterday and today", so a call at 9am yesterday drops out of the report at 9am today. The other two presets are calendar ranges in your organization's timezone: **Last 7 days** is today plus the six days before it, and **Last 30 days** is today plus the previous 29. Picking dates on the calendar and applying them replaces the preset with a custom range.
The workspace report defaults to the last 14 days and offers Today, Last 7, 14, 30 and 90 days.
Times follow the workspace timezone, so the report reads the same for everyone regardless of where they are viewing it from. At the organization level, the report uses the timezone shared by most of your workspaces and shows which one it is next to the date picker.
## Reading the team table
The per-member table (**Workforce → Team** at the organization level) shows calls **offered**, **accepted**, **declined** and **timed out**, plus an answer rate.
Offered counts every time the queue rang that person, so one call can be offered to several people. Declined means they actively rejected it; timed out means it rang and went unanswered. A high timed-out count next to a low declined count usually means the person was away from their desk rather than refusing calls.
Treat this table as a starting point for a conversation, not a verdict. It cannot tell the difference between someone ignoring a call and someone who stepped away without setting themselves to away.
## Exporting
**Export CSV** produces the same numbers as the screen: headline metrics (including queue calls, missed calls excluding abandoned, abandoned count, and abandoned call rate), the per-member table, and per-bucket volumes. At the organization level it also includes a row per workspace with queue calls, answered, missed, the three missed reasons, and abandoned as a separate column, so the workspace table above can be reproduced in a spreadsheet.
This documentation is built and hosted on [Mintlify](https://mintlify.com), a developer documentation platform.
Workforce opens on **Last 24 hours**: a rolling window from exactly 24 hours ago to now, bucketed by the hour. It is not "yesterday and today", so a call at 9am yesterday drops out of the report at 9am today. The other two presets are calendar ranges in your organization's timezone: **Last 7 days** is today plus the six days before it, and **Last 30 days** is today plus the previous 29. Picking dates on the calendar and applying them replaces the preset with a custom range.
The workspace report defaults to the last 14 days and offers Today, Last 7, 14, 30 and 90 days.
Times follow the workspace timezone, so the report reads the same for everyone regardless of where they are viewing it from. At the organization level, the report uses the timezone shared by most of your workspaces and shows which one it is next to the date picker.
## Reading the team table
The per-member table (**Workforce → Team** at the organization level) shows calls **offered**, **accepted**, **declined** and **timed out**, plus an answer rate.
Offered counts every time the queue rang that person, so one call can be offered to several people. Declined means they actively rejected it; timed out means it rang and went unanswered. A high timed-out count next to a low declined count usually means the person was away from their desk rather than refusing calls.
Treat this table as a starting point for a conversation, not a verdict. It cannot tell the difference between someone ignoring a call and someone who stepped away without setting themselves to away.
## Exporting
**Export CSV** produces the same numbers as the screen: headline metrics (including queue calls, missed calls excluding abandoned, abandoned count, and abandoned call rate), the per-member table, and per-bucket volumes. At the organization level it also includes a row per workspace with queue calls, answered, missed, the three missed reasons, and abandoned as a separate column, so the workspace table above can be reproduced in a spreadsheet.
This documentation is built and hosted on [Mintlify](https://mintlify.com), a developer documentation platform.